Student survey data is only powerful when it’s fresh. And here at Media Prefs HQ, your student data is refreshed twice a year — and that’s not all. We’re celebrating Media Prefs’ 10th anniversary of going digital, making for a decade of digital data that also gives college marketers the long view of student trends.

And if you’re still using outreach tactics that worked 10 years ago but haven’t checked in with your data lately? Just like leather leggings and Vines have gone the way of Myspace, you might want to refresh your outreach by leveraging our powerful Media Prefs student survey!
In this blog, we’ll show how drastically marketing trends and media preferences have changed for community college students. So, if you need to convince a board member still living in 2012 that print newspapers are not a good place to advertise, and yes, all students do have smartphones? Then you’ll have support in your back pocket for running up-to-date advertising and promotions!
Decade Divergence: Media Prefs Student Survey Reveals Two Seismic Shifts in 2016 and 2020
While it’s no surprise that the pandemic altered so many student preferences for good in 2020, we often forget about the other big shift in the last decade. Remember 2016, when the rise of streaming content coupled with new social media platforms transformed the marketing landscape?
“The fall 2016 data showed us many new crossing lines in our charts,” says Jamie Wagner, Executive Director of Media Prefs. “And what Dr. Pam Cox-Otto always says is that ‘When the lines crossed, “shift” happened,’” recalls Wagner. “Though, she may have used a more colorful word!”
2016 and the Rise of Streaming Music
Then: 69% Pandora, 9% Spotify
Now: 40% Spotify, 21% Apple Music, 8% Pandora
According to Rolling Stone, 2016 marked when streaming music became the biggest revenue generator for the first time. And the data from our Media Prefs student surveys certainly reflected that shift and more, especially when it came to students’ favorite music streaming platforms.
“Pandora was the preferred platform for nearly 70% of community college students ten years ago,” says Wagner. “Now, Pandora use is super, super tiny. It’s a mega shift that happened over the last decade.”
Streaming music’s popularity has only increased nationwide. And when it comes to students’ preferred streaming platforms, Spotify is always spot on.
Meanwhile, Apple Music is becoming a preferred choice for students who stream as well. Local radio has steadily become irrelevant to younger students but still maintains a slight grip on those 51+.
Student Surveys Weigh In on Streaming TV
The year 2016 also marks when streaming TV doubled its original shows just as cable TV’s offerings declined, according to Polygon.
Do you remember back in the day when most people were watching shows on TV or DVR? Ten years ago, only 1% of students watched shows on mobile devices. Now, we can’t get students to put their smartphones down!
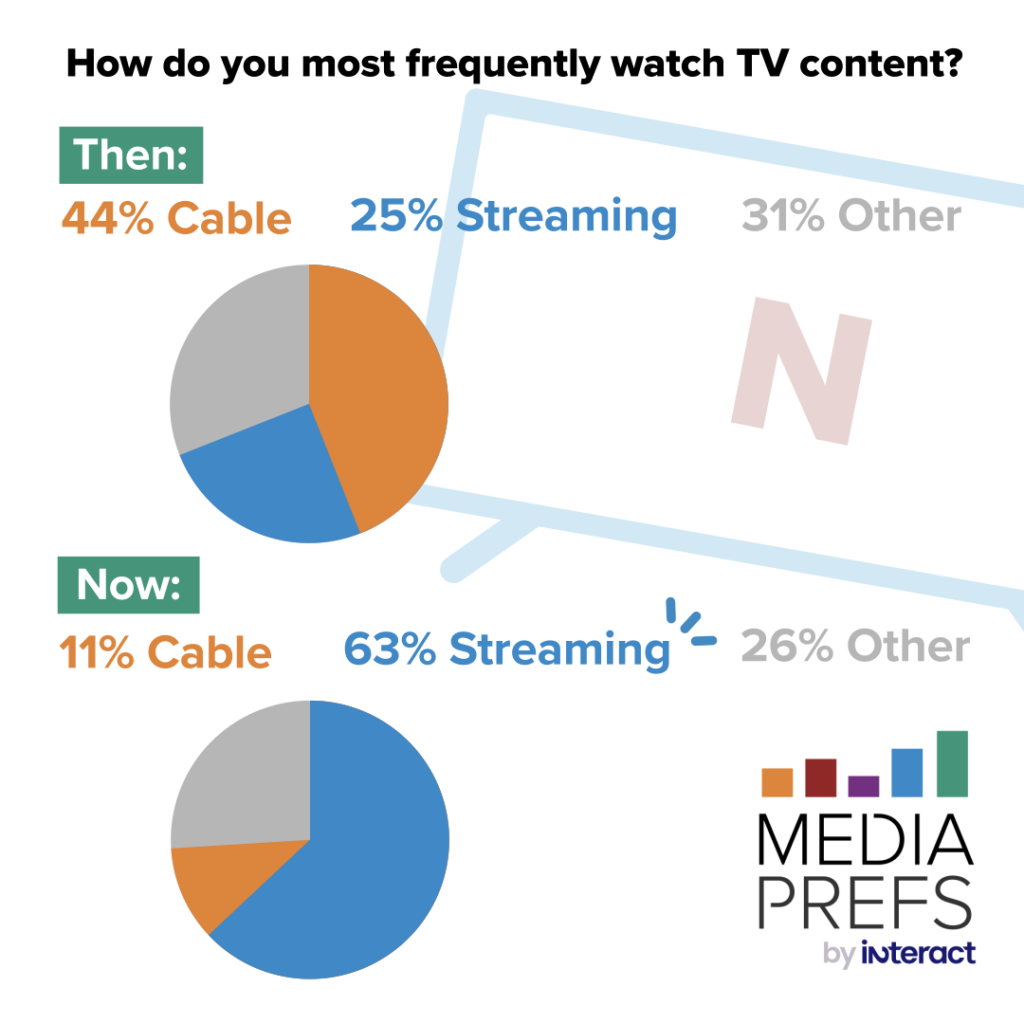
“Ten years ago, only 25% of community college students streamed their television content,” says Wagner. “When we aggregate the data, that number has now jumped to 63% — and that’s significant.”
Students’ TV consumption habits have also shifted. Ten years ago, students watched a lot less TV during the week. Tube time peaked on Friday and Saturday nights, but Sunday night had low viewership.
Fast-forward to 2023, and now students consistently consume TV content throughout the week, primarily between 6 p.m. and midnight. And while viewing times are slightly elevated on weekends, the preference is not as drastic.
Social Media Before and After 2016
Then: 56-71% (by age) say Facebook
Now: Younger audiences — TikTok;
Older audiences — Facebook
Remember when Foursquare was a thing? A decade ago, students were tuning in, but now, the platform is covered in cyber dust. “The funniest thing is seeing old social media channels that flopped as the years went on,” says Wagner. Might Twitter be next? Only time will tell!
Our data lines for social use certainly crossed in 2016 in our student surveys. Why? Because that was the year when TikTok hit the social media scene.
“We were watching TikTok climb, back when it was Musical.ly — students were writing in the platform as their favorite in higher and higher numbers,” says Wagner.
As early as July 2015, Musical.ly built a following that outpaced Facebook, YouTube, and Instagram on iOS, according to Influencer Marketing Hub.
Fast-forward to 2020, and that popularity continued to soar.
“The pandemic really did work for TikTok,” says Wagner. “That initial jump in usage and popularity was one of the highest we’ve ever seen.”
Most popular with 18–20-year-old female students, our Media Prefs data showed TikTok quickly overtaking Twitter, Snapchat, and Instagram in its climb to the coveted “favorite” social media platform for this important demographic in the first year of the pandemic.
What about Snapchat and Facebook?

Facebook might still be popular with older audiences, but not according to Gen Z!
But don’t forget the other social media contender from 2016!
“Snapchat had a few back-to-back semesters of really strong climbs beginning in 2015, ultimately peaking in 2017,” shares Wagner. “Eyes moved away from Facebook and Instagram and onto Snapchat.”
Nationally, Snapchat began reaching up to 10 billion daily video views in 2016, according to Wikipedia’s Snapchat Timeline.
Social platform usage and preference vary strongly by age and gender. When aggregated, we’ve seen Facebook’s popularity fall over the years, from nearly 75% in 2012 to 16%, most recently in 2023. Remember: Platform usage might look different from your student preferences. So, when in doubt, always follow the data for platform usage so that you can target students where they’re spending the most time.
But don’t count Facebook out! Even though the platform has taken some dips, it’s remained a strong contender for loyal demographics. “Facebook is still a really great investment for students 31 and older,” says Wagner.
“If you only look at older populations, Facebook is still alive and kicking. But for younger males and females, Facebook died back in 2016.”
Student Survey Says: 2020 Rocked Outreach Strategies
Back in the day, we used to ask students, “Do you have a smartphone?” Ten years ago, only two-thirds of 16-20-year-olds had one. But that all changed as technology evolved and smartphones became more of a necessity than a luxury.
“After reaching 98% of students who said they had a smartphone, we stopped asking that question entirely,” says Wagner.
Even the oldest group of adult students, those that hung on from doing the smartphone conversion as long as they could, finally gave in to the technology wave. Their usage increased from about 60% to nearly 100% by 2020.
“Colleges were having a problem believing that students have real-time access to communications,” says Wagner. Well, think again!
Once smartphones became a given, we started asking a new question: What operating system does your phone use? With the big tracking and data collection changes in 2020 and 2021 for iOS, that question became pressing.
“Three out of four students ages 18-25 have Apple devices, which is huge,” says Wagner.
We’ll be taking a deep dive into the new cookie and privacy settings on the web, so stay tuned for future blogs!
Zooming into QR Codes: Here to Stay
Back in the days of yore, 67% of students had never used a QR code before. After 2020, that number shrank to just 8%.
“When you ordered food, they didn’t have menus — you’d have to scan a QR code to go out to eat,” explains Wagner. “During the pandemic, people started to get really comfortable with QR codes out of necessity.”
And don’t forget Zoom. Before the pandemic, video calls weren’t popular until they became our best option to stay connected. And that preference is here to stay. According to Wagner, “Zoom and Teams calls became a preferred method of communication in the post-COVID world, and some students prefer it over a standard phone call.”
How to Crunch the Data to Supercharge Your Marketing
When it comes to drilling down into student survey data to find the best outreach strategies for your marketing, Media Prefs can clue you in to your exact target audiences.
“You can look at the data in a million different ways, by age, gender, ethnicity, if they prefer online versus in-person classes, and more,” says Wagner.
Fast-forward to 2023, and Media Prefs has become even more robust, with new features, new questions, and a data portal that’s easier to use than ever before.
“No big data report from an external company can pinpoint your students’ preferences better than Media Prefs because we focus on community college students.
“No one is going to say it better than your own students.”
Learn more about the newest version of Media Prefs and save your spot today!